Note
Click here to download the full example code
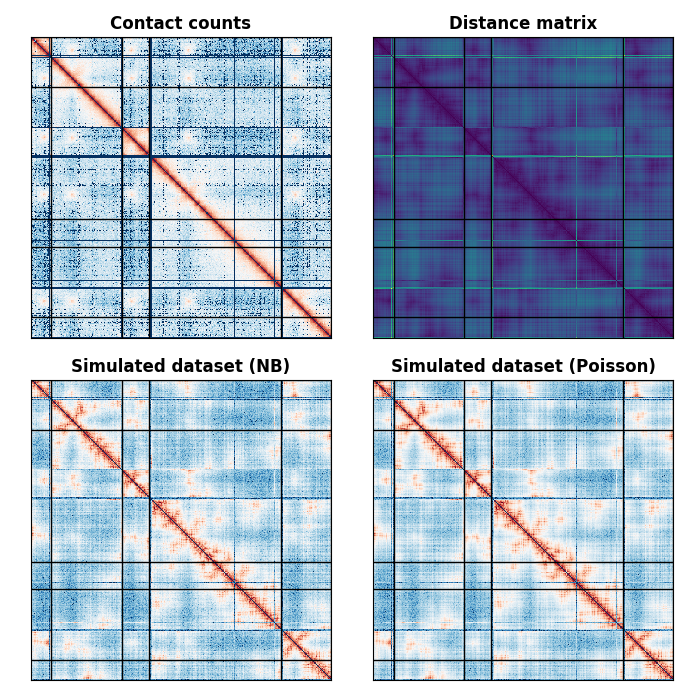
This example showcases how to generated a random dataset from a distance matrix using different probability distribution.
import numpy as np
import matplotlib.pyplot as plt
from matplotlib import colors

from sklearn.metrics import euclidean_distances

from pastis import datasets
from pastis.optimization.mds import estimate_X
import iced
Generate a 3D structure from a toy dataset
counts, lengths = iced.datasets.load_sample_yeast()
counts = iced.filter.filter_low_counts(counts, remove_all_zeros_loci=True,
                                       sparsity=False)
counts = iced.normalization.ICE_normalization(counts)
structure = estimate_X(counts)
distances = euclidean_distances(structure, structure)
Out:
/home/nelle/Projects/research/softwares/iced/iced/io/_io_pandas.py:56: UserWarning: Attempting to guess whether counts are 0 or 1 based
  warnings.warn(
Now, generate the contact count matrix from the distance matrix
negative_binomial_count = datasets.generate_dataset_from_distances(
    distances, alpha=-3, distribution="NegativeBinomial")
poisson_count = datasets.generate_dataset_from_distances(
    distances, alpha=-3, distribution="Poisson", lengths=lengths,
    alpha_inter=-2)
Plot the resulting contact count matrices
fig, axes = plt.subplots(figsize=(7, 7),
                         ncols=2, nrows=2, tight_layout=True)


def plot_matrix(ax, matrix, cmap="RdBu_r", norm=None, lengths=None):
    if lengths is None:
        lengths = np.array([matrix.shape[0]])
    ax.matshow(matrix, cmap=cmap, norm=norm,
               extent=(0, lengths.sum(), 0, lengths.sum()))
    [ax.axhline(i, linewidth=1, color="#000000") for i in lengths.cumsum()]
    [ax.axvline(i, linewidth=1, color="#000000") for i in lengths.cumsum()]
    ax.set_xticks([])
    ax.set_yticks([])


# First, plot the original contact count matrix
plot_matrix(axes[0, 0], counts, norm=colors.SymLogNorm(1), lengths=lengths)
axes[0, 0].set_title("Contact counts", fontweight="bold")

# Plot the distance matrix used as input to the generated data function
plot_matrix(axes[0, 1], distances, cmap="viridis", lengths=lengths)
axes[0, 1].set_title("Distance matrix", fontweight="bold")

# The negative binomial counts
plot_matrix(axes[1, 0], negative_binomial_count, norm=colors.SymLogNorm(1),
            lengths=lengths)
axes[1, 0].set_title("Simulated dataset (NB)", fontweight="bold")

# The Poisson dataset
plot_matrix(axes[1, 1], poisson_count, norm=colors.SymLogNorm(1),
            lengths=lengths)
axes[1, 1].set_title("Simulated dataset (Poisson)", fontweight="bold")
Out:
/home/nelle/Projects/research/softwares/pastis/examples/datasets/plot_generate_dataset_from_distances.py:55: MatplotlibDeprecationWarning: default base will change from np.e to 10 in 3.4.  To suppress this warning specify the base keyword argument.
  plot_matrix(axes[0, 0], counts, norm=colors.SymLogNorm(1), lengths=lengths)
/home/nelle/Projects/research/softwares/pastis/examples/datasets/plot_generate_dataset_from_distances.py:63: MatplotlibDeprecationWarning: default base will change from np.e to 10 in 3.4.  To suppress this warning specify the base keyword argument.
  plot_matrix(axes[1, 0], negative_binomial_count, norm=colors.SymLogNorm(1),
/home/nelle/Projects/research/softwares/pastis/examples/datasets/plot_generate_dataset_from_distances.py:68: MatplotlibDeprecationWarning: default base will change from np.e to 10 in 3.4.  To suppress this warning specify the base keyword argument.
  plot_matrix(axes[1, 1], poisson_count, norm=colors.SymLogNorm(1),

Text(0.5, 1.0, 'Simulated dataset (Poisson)')
Total running time of the script: ( 0 minutes 0.855 seconds)


