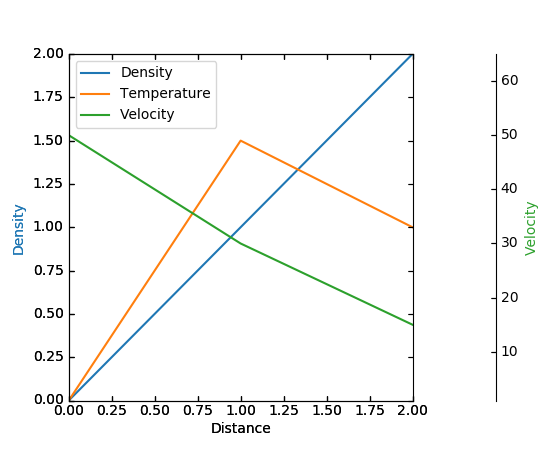
(Source code, png, pdf)

from mpl_toolkits.axes_grid1 import host_subplot
import mpl_toolkits.axisartist as AA
import matplotlib.pyplot as plt

if 1:

    host = host_subplot(111, axes_class=AA.Axes)
    plt.subplots_adjust(right=0.75)

    par1 = host.twinx()
    par2 = host.twinx()

    offset = 60
    new_fixed_axis = par2.get_grid_helper().new_fixed_axis
    par2.axis["right"] = new_fixed_axis(loc="right",
                                        axes=par2,
                                        offset=(offset, 0))

    par2.axis["right"].toggle(all=True)

    host.set_xlim(0, 2)
    host.set_ylim(0, 2)

    host.set_xlabel("Distance")
    host.set_ylabel("Density")
    par1.set_ylabel("Temperature")
    par2.set_ylabel("Velocity")

    p1, = host.plot([0, 1, 2], [0, 1, 2], label="Density")
    p2, = par1.plot([0, 1, 2], [0, 3, 2], label="Temperature")
    p3, = par2.plot([0, 1, 2], [50, 30, 15], label="Velocity")

    par1.set_ylim(0, 4)
    par2.set_ylim(1, 65)

    host.legend()

    host.axis["left"].label.set_color(p1.get_color())
    par1.axis["right"].label.set_color(p2.get_color())
    par2.axis["right"].label.set_color(p3.get_color())

    plt.draw()
    plt.show()

    #plt.savefig("Test")
Keywords: python, matplotlib, pylab, example, codex (see Search examples)