

(Source code, png, pdf)

"""
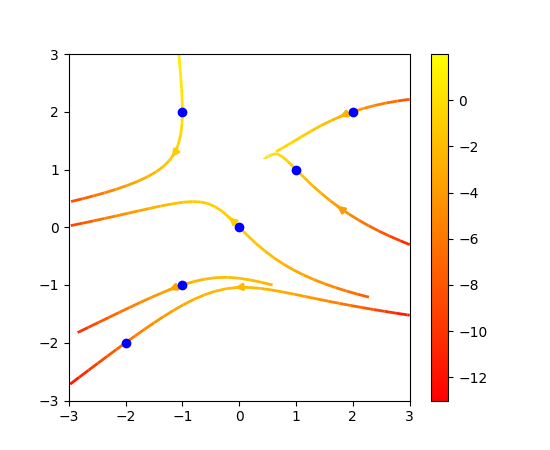
Demo of the streamplot function with starting points.
This example shows how to fix the streamlines that are plotted, by passing
an array of seed points to the `start_points` keyword argument.
"""
import numpy as np
import matplotlib.pyplot as plt
Y, X = np.mgrid[-3:3:100j, -3:3:100j]
U = -1 - X**2 + Y
V = 1 + X - Y**2
# 5 points along the first diagonal and a point in the left upper quadrant
seed_points = np.array([[-2, -1, 0, 1, 2, -1], [-2, -1, 0, 1, 2, 2]])
fig, ax = plt.subplots()
strm = ax.streamplot(X, Y, U, V, color=U, linewidth=2,
cmap=plt.cm.autumn, start_points=seed_points.T)
fig.colorbar(strm.lines)
ax.plot(seed_points[0], seed_points[1], 'bo')
ax.axis((-3, 3, -3, 3))
plt.show()
Keywords: python, matplotlib, pylab, example, codex (see Search examples)