

(Source code, png, pdf)

"""
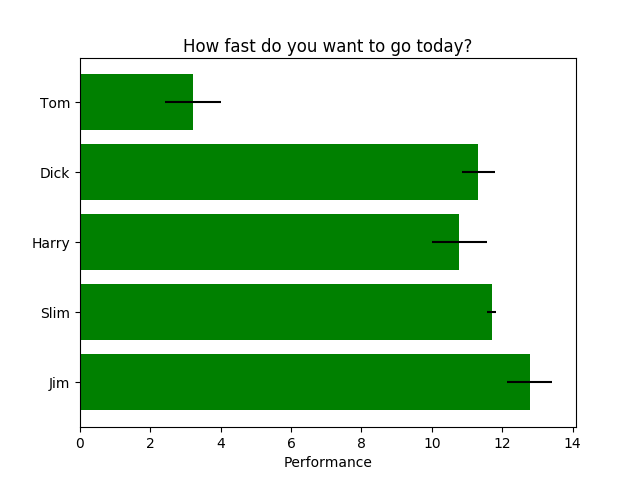
======================================
Simple demo of a horizontal bar chart
======================================
fixme
"""
import matplotlib.pyplot as plt
import numpy as np
plt.rcdefaults()
fig, ax = plt.subplots()
# Example data
people = ('Tom', 'Dick', 'Harry', 'Slim', 'Jim')
y_pos = np.arange(len(people))
performance = 3 + 10 * np.random.rand(len(people))
error = np.random.rand(len(people))
ax.barh(y_pos, performance, xerr=error, align='center',
color='green', ecolor='black')
ax.set_yticks(y_pos)
ax.set_yticklabels(people)
ax.invert_yaxis() # labels read top-to-bottom
ax.set_xlabel('Performance')
ax.set_title('How fast do you want to go today?')
plt.show()
Keywords: python, matplotlib, pylab, example, codex (see Search examples)