

(Source code, png, pdf)

'''
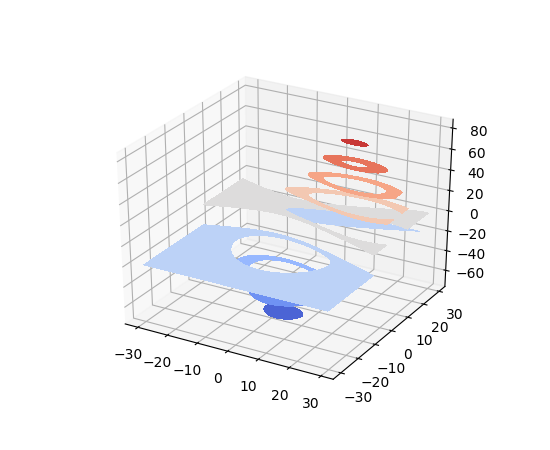
contourf differs from contour in that it creates filled contours, ie.
a discrete number of colours are used to shade the domain.
This is like a contourf plot in 2D except that the shaded region corresponding
to the level c is graphed on the plane z=c.
'''
from mpl_toolkits.mplot3d import axes3d
import matplotlib.pyplot as plt
from matplotlib import cm
fig = plt.figure()
ax = fig.gca(projection='3d')
X, Y, Z = axes3d.get_test_data(0.05)
cset = ax.contourf(X, Y, Z, cmap=cm.coolwarm)
ax.clabel(cset, fontsize=9, inline=1)
plt.show()
Keywords: python, matplotlib, pylab, example, codex (see Search examples)