

import matplotlib.mlab as mlab
from matplotlib.pyplot import figure, show
import numpy as np
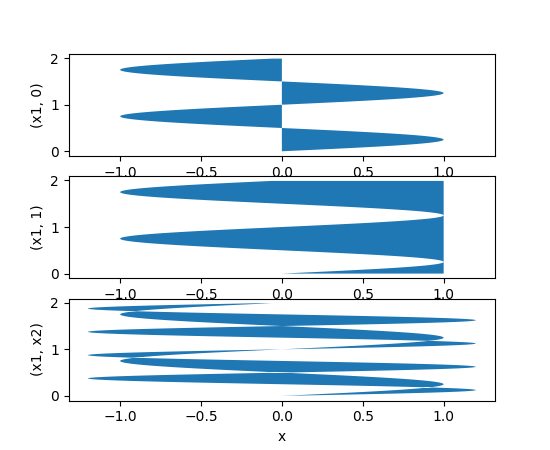
y = np.arange(0.0, 2, 0.01)
x1 = np.sin(2*np.pi*y)
x2 = 1.2*np.sin(4*np.pi*y)
fig = figure()
ax1 = fig.add_subplot(311)
ax2 = fig.add_subplot(312, sharex=ax1)
ax3 = fig.add_subplot(313, sharex=ax1)
ax1.fill_betweenx(y, 0, x1)
ax1.set_ylabel('(x1, 0)')
ax2.fill_betweenx(y, x1, 1)
ax2.set_ylabel('(x1, 1)')
ax3.fill_betweenx(y, x1, x2)
ax3.set_ylabel('(x1, x2)')
ax3.set_xlabel('x')
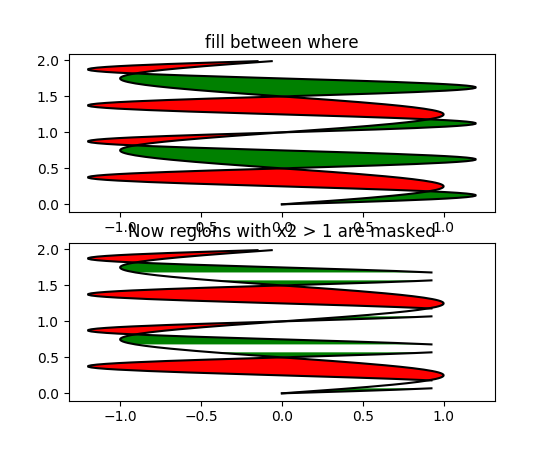
# now fill between x1 and x2 where a logical condition is met. Note
# this is different than calling
# fill_between(y[where], x1[where], x2[where])
# because of edge effects over multiple contiguous regions.
fig = figure()
ax = fig.add_subplot(211)
ax.plot(x1, y, x2, y, color='black')
ax.fill_betweenx(y, x1, x2, where=x2 >= x1, facecolor='green')
ax.fill_betweenx(y, x1, x2, where=x2 <= x1, facecolor='red')
ax.set_title('fill between where')
# Test support for masked arrays.
x2 = np.ma.masked_greater(x2, 1.0)
ax1 = fig.add_subplot(212, sharex=ax)
ax1.plot(x1, y, x2, y, color='black')
ax1.fill_betweenx(y, x1, x2, where=x2 >= x1, facecolor='green')
ax1.fill_betweenx(y, x1, x2, where=x2 <= x1, facecolor='red')
ax1.set_title('Now regions with x2 > 1 are masked')
# This example illustrates a problem; because of the data
# gridding, there are undesired unfilled triangles at the crossover
# points. A brute-force solution would be to interpolate all
# arrays to a very fine grid before plotting.
show()
Keywords: python, matplotlib, pylab, example, codex (see Search examples)

