

(Source code, png, pdf)
"""
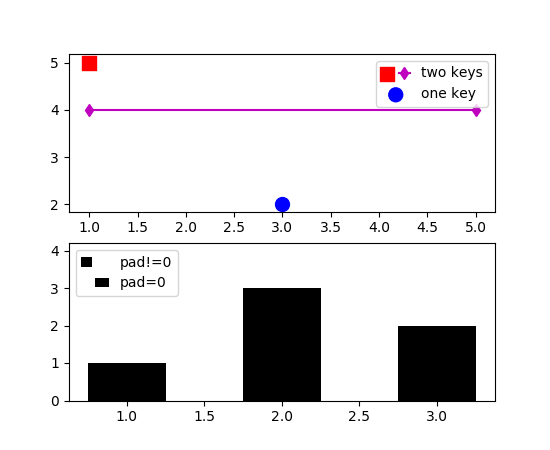
Showcases legend entries with more than one legend key.
"""
import matplotlib.pyplot as plt
from matplotlib.legend_handler import HandlerTuple
fig, (ax1, ax2) = plt.subplots(2, 1)
# First plot: two legend keys for a single entry
p1 = ax1.scatter([1], [5], c='r', marker='s', s=100)
p2 = ax1.scatter([3], [2], c='b', marker='o', s=100)
# `plot` returns a list, but we want the handle - thus the comma on the left
p3, = ax1.plot([1, 5], [4, 4], 'm-d')
# Assign two of the handles to the same legend entry by putting them in a tuple
# and using a generic handler map (which would be used for any additional
# tuples of handles like (p1, p3)).
l = ax1.legend([(p1, p3), p2], ['two keys', 'one key'], scatterpoints=1,
numpoints=1, handler_map={tuple: HandlerTuple(ndivide=None)})
# Second plot: plot two bar charts on top of each other and change the padding
# between the legend keys
x_left = [1, 2, 3]
y_pos = [1, 3, 2]
y_neg = [2, 1, 4]
rneg = ax2.bar(x_left, y_neg, width=0.5, color='w', hatch='///', label='-1')
rpos = ax2.bar(x_left, y_pos, width=0.5, color='k', label='+1')
# Treat each legend entry differently by using specific `HandlerTuple`s
l = ax2.legend([(rpos, rneg), (rneg, rpos)], ['pad!=0', 'pad=0'],
handler_map={(rpos, rneg): HandlerTuple(ndivide=None),
(rneg, rpos): HandlerTuple(ndivide=None, pad=0.)})
plt.show()
Keywords: python, matplotlib, pylab, example, codex (see Search examples)