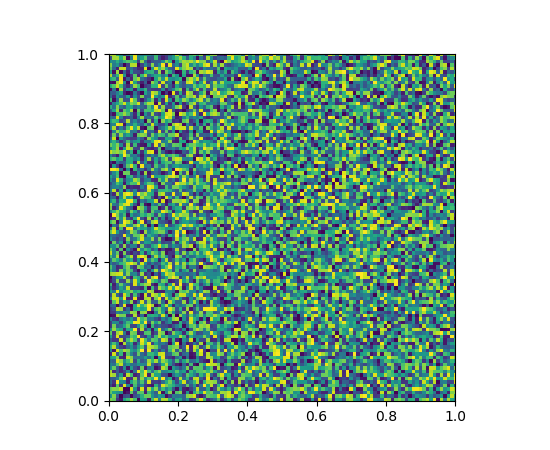
(Source code, png, pdf)

""" toggle between two images by pressing "t"

The basic idea is to load two images (they can be different shapes) and plot
them to the same axes with hold "on".  Then, toggle the visible property of
them using keypress event handling

If you want two images with different shapes to be plotted with the same
extent, they must have the same "extent" property

As usual, we'll define some random images for demo.  Real data is much more
exciting!

Note, on the wx backend on some platforms (e.g., linux), you have to
first click on the figure before the keypress events are activated.
If you know how to fix this, please email us!

"""

import matplotlib.pyplot as plt
import numpy as np

# two images x1 is initially visible, x2 is not
x1 = np.random.random((100, 100))
x2 = np.random.random((150, 175))

# arbitrary extent - both images must have same extent if you want
# them to be resampled into the same axes space
extent = (0, 1, 0, 1)
im1 = plt.imshow(x1, extent=extent)
im2 = plt.imshow(x2, extent=extent, hold=True)
im2.set_visible(False)


def toggle_images(event):
    'toggle the visible state of the two images'
    if event.key != 't':
        return
    b1 = im1.get_visible()
    b2 = im2.get_visible()
    im1.set_visible(not b1)
    im2.set_visible(not b2)
    plt.draw()

plt.connect('key_press_event', toggle_images)

plt.show()
Keywords: python, matplotlib, pylab, example, codex (see Search examples)