

(Source code, png, pdf)

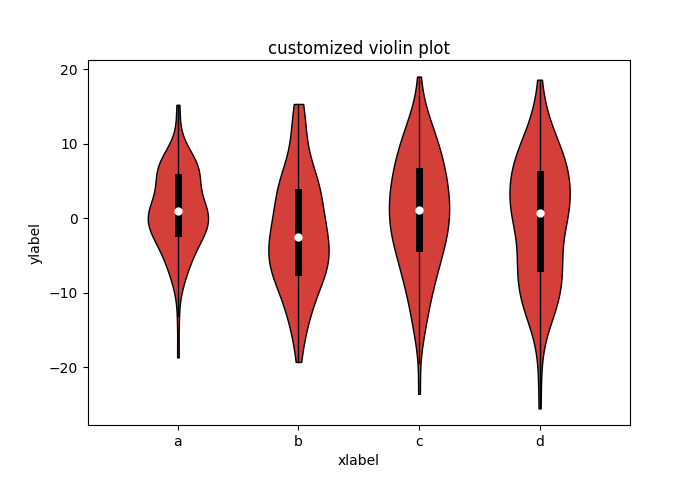
# Customizing violin plots
#
#

import matplotlib.pyplot as plt
import numpy as np


# functions to calculate percentiles and adjacent values
def percentile(vals, p):
    N = len(vals)
    n = p*(N+1)
    k = int(n)
    d = n-k
    if k <= 0:
        return vals[0]
    if k >= N:
        return vals[N-1]
    return vals[k-1] + d*(vals[k] - vals[k-1])


def adjacent_values(vals):
    q1 = percentile(vals, 0.25)
    q3 = percentile(vals, 0.75)
    uav = q3 + (q3-q1)*1.5
    if uav > vals[-1]:
        uav = vals[-1]
    if uav < q3:
        uav = q3
    lav = q1 - (q3-q1)*1.5
    if lav < vals[0]:
        lav = vals[0]
    if lav > q1:
        lav = q1
    return [lav, uav]

# create test data
dat = [np.random.normal(0, std, 100) for std in range(6, 10)]
lab = ['a', 'b', 'c', 'd']    # labels
med = []    # medians
iqr = []    # inter-quantile ranges
avs = []    # upper and lower adjacent values
for arr in dat:
    sarr = sorted(arr)
    med.append(percentile(sarr, 0.5))
    iqr.append([percentile(sarr, 0.25), percentile(sarr, 0.75)])
    avs.append(adjacent_values(sarr))

# plot the violins
fig, ax = plt.subplots(nrows=1, ncols=1, figsize=(7, 5))
parts = ax.violinplot(dat, showmeans=False, showmedians=False,
                      showextrema=False)

# plot medians and averages
for i in range(len(med)):
    ax.plot([i+1, i+1], avs[i], '-', c='black', lw=1)
    ax.plot([i+1, i+1], iqr[i], '-', c='black', lw=5)
    ax.plot(i+1, med[i], 'o', mec='none', c='white', ms=6)

# customize colors
for pc in parts['bodies']:
    pc.set_facecolor('#D43F3A')
    pc.set_edgecolor('black')
    pc.set_alpha(1)

ax.get_xaxis().set_tick_params(direction='out')
ax.xaxis.set_ticks_position('bottom')
ax.set_xticks([x+1 for x in range(len(lab))])
ax.set_xticklabels(lab)
ax.set_xlim(0.25, len(lab)+0.75)
ax.set_ylabel('ylabel')
ax.set_xlabel('xlabel')
ax.set_title('customized violin plot')

plt.subplots_adjust(bottom=0.15)

plt.show()
Keywords: python, matplotlib, pylab, example, codex (see Search examples)