

(Source code, png, pdf)

'''
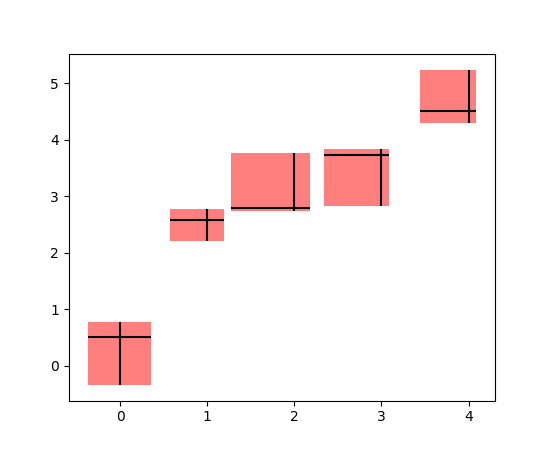
Example to create boxes from error using PatchCollection
'''
import numpy as np
import matplotlib.pyplot as plt
from matplotlib.collections import PatchCollection
from matplotlib.patches import Rectangle
# Number of data points
n = 5
# Dummy data
x = np.arange(0, n, 1)
y = np.random.rand(n)*5.
# Dummy errors (above and below)
xerr = np.random.rand(2, n)
yerr = np.random.rand(2, n)
# Create figure and axes
fig, ax = plt.subplots(1)
def make_error_boxes(ax, xdata, ydata, xerror, yerror, fc='r', ec='None', alpha=0.5):
# Create list for all the error patches
errorboxes = []
# Loop over data points; create box from errors at each point
for xc, yc, xe, ye in zip(xdata, ydata, xerror.T, yerror.T):
rect = Rectangle((xc-xe[0], yc-ye[0]), xe.sum(), ye.sum())
errorboxes.append(rect)
# Create patch collection with specified colour/alpha
pc = PatchCollection(errorboxes, facecolor=fc, alpha=alpha, edgecolor=ec)
# Add collection to axes
ax.add_collection(pc)
# Plot errorbars
ax.errorbar(xdata, ydata, xerr=xerror, yerr=yerror, fmt='None', ecolor='k')
# Call function to create error boxes
make_error_boxes(ax, x, y, xerr, yerr)
plt.show()
Keywords: python, matplotlib, pylab, example, codex (see Search examples)