
Warning
axisartist uses a custom Axes class (derived from the mpl’s original Axes class). As a side effect, some commands (mostly tick-related) do not work.
The axisartist contains custom Axes class that is meant to support for curvilinear grids (e.g., the world coordinate system in astronomy). Unlike mpl’s original Axes class which uses Axes.xaxis and Axes.yaxis to draw ticks, ticklines and etc., Axes in axisartist uses special artist (AxisArtist) which can handle tick, ticklines and etc. for curved coordinate systems.
(Source code, png, pdf)
Since it uses special artists, some mpl commands that work on Axes.xaxis and Axes.yaxis may not work.
axisartist module provides a custom (and very experimental) Axes class, where each axis (left, right, top and bottom) have a separate associated artist which is responsible to draw axis-line, ticks, ticklabels, label. Also, you can create your own axis, which can pass through a fixed position in the axes coordinate, or a fixed position in the data coordinate (i.e., the axis floats around when viewlimit changes).
The axes class, by default, has its xaxis and yaxis invisible, and has 4 additional artists which are responsible for drawing the 4 axis sides in “left”,”right”,”bottom” and “top”. They are accessed as ax.axis[“left”], ax.axis[“right”], and so on, i.e., ax.axis is a dictionary that contains artists (note that ax.axis is still a callable methods and it behaves as an original Axes.axis method in mpl).
To create an axes,
import mpl_toolkits.axisartist as AA
fig = plt.figure(1)
ax = AA.Axes(fig, [0.1, 0.1, 0.8, 0.8])
fig.add_axes(ax)
or to create a subplot
ax = AA.Subplot(fig, 111)
fig.add_subplot(ax)
For example, you can hide the right, and top axis by
ax.axis["right"].set_visible(False)
ax.axis["top"].set_visible(False)
(Source code, png, pdf)
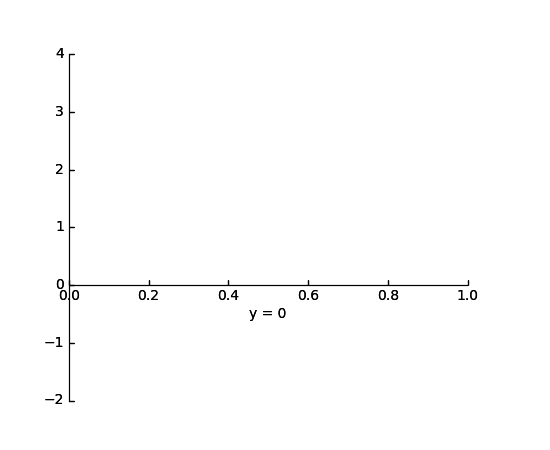
It is also possible to add an extra axis. For example, you may have an horizontal axis at y=0 (in data coordinate).
ax.axis["y=0"] = ax.new_floating_axis(nth_coord=0, value=0)
import matplotlib.pyplot as plt
import mpl_toolkits.axisartist as AA

fig = plt.figure(1)
fig.subplots_adjust(right=0.85)
ax = AA.Subplot(fig, 1, 1, 1)
fig.add_subplot(ax)

# make some axis invisible
ax.axis["bottom", "top", "right"].set_visible(False)

# make an new axis along the first axis axis (x-axis) which pass
# throught y=0.
ax.axis["y=0"] = ax.new_floating_axis(nth_coord=0, value=0,
                                      axis_direction="bottom")
ax.axis["y=0"].toggle(all=True)
ax.axis["y=0"].label.set_text("y = 0")

ax.set_ylim(-2, 4)

plt.show()
(Source code, png, pdf)
Or a fixed axis with some offset
# make new (right-side) yaxis, but wth some offset
ax.axis["right2"] = ax.new_fixed_axis(loc="right",
                                      offset=(20, 0))
Most commands in the axes_grid1 toolkit can take a axes_class keyword argument, and the commands creates an axes of the given class. For example, to create a host subplot with axisartist.Axes,
import mpl_tookits.axisartist as AA
from mpl_toolkits.axes_grid1 import host_subplot

host = host_subplot(111, axes_class=AA.Axes)
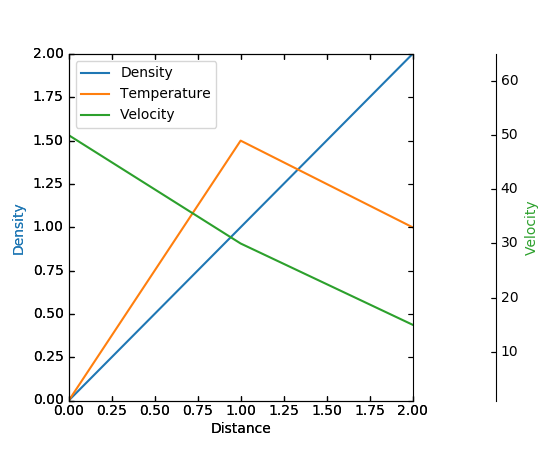
Here is an example that uses parasiteAxes.
(Source code, png, pdf)
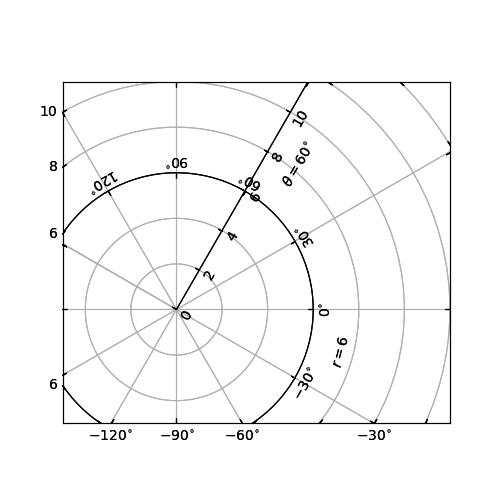
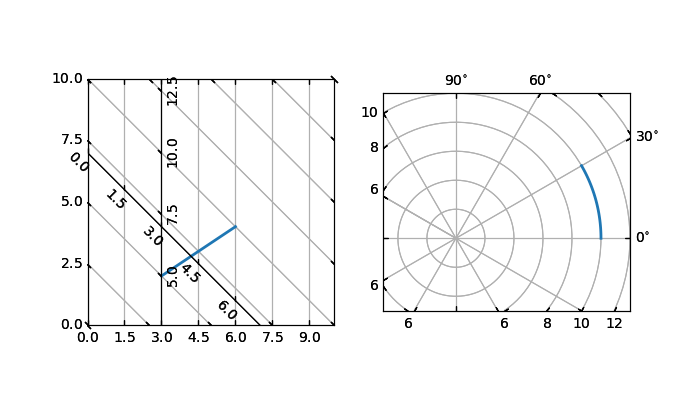
The motivation behind the AxisArtist module is to support curvilinear grid and ticks.
(Source code, png, pdf)

See axisartist namespace for more details.
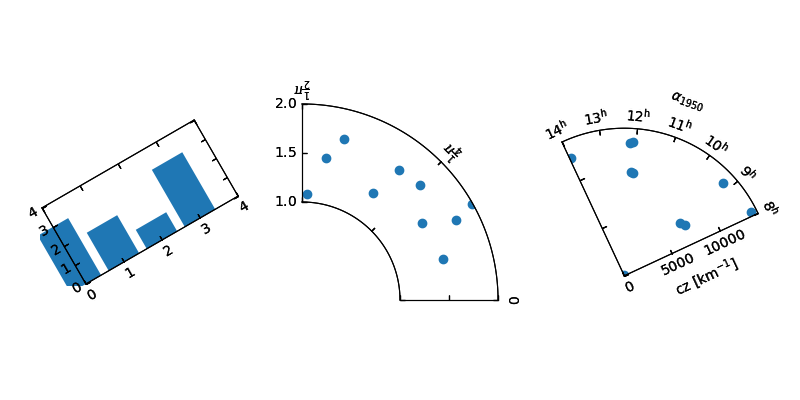
This also support a Floating Axes whose outer axis are defined as floating axis.
(Source code, png, pdf)

