matplotlib

Travis-CI:

This Page

matplotlib.axes.Axes.fill_between

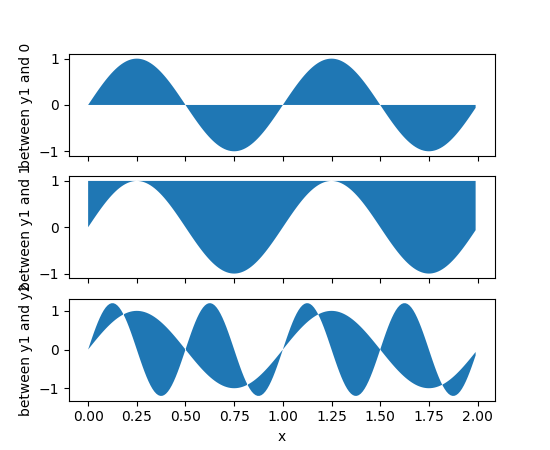
Axes.fill_between(x, y1, y2=0, where=None, interpolate=False, step=None, **kwargs)

Make filled polygons between two curves.

Create a PolyCollection filling the regions between y1 and y2 where where==True

Parameters:

x : array

An N-length array of the x data

y1 : array

An N-length array (or scalar) of the y data

y2 : array

An N-length array (or scalar) of the y data

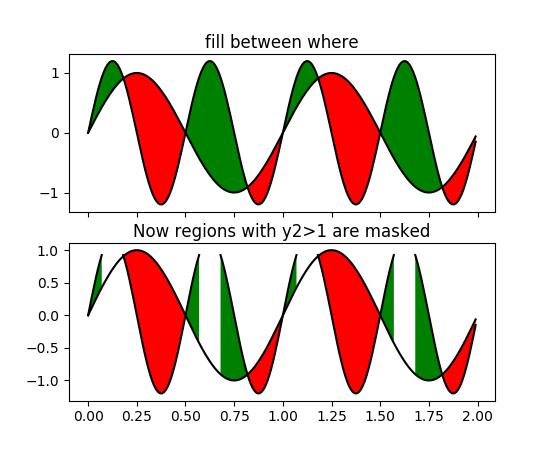
where : array, optional

If None, default to fill between everywhere. If not None, it is an N-length numpy boolean array and the fill will only happen over the regions where where==True.

interpolate : bool, optional

If True, interpolate between the two lines to find the precise point of intersection. Otherwise, the start and end points of the filled region will only occur on explicit values in the x array.

step : {‘pre’, ‘post’, ‘mid’}, optional

If not None, fill with step logic.

Notes

In addition to the above described arguments, this function can take a data keyword argument. If such a data argument is given, the following arguments are replaced by data[<arg>]:

  • All arguments with the following names: ‘where’, ‘x’, ‘y1’, ‘y2’.

Examples

(Source code)

../../_images/fill_between_demo_00.png

(png, pdf)

../../_images/fill_between_demo_01.png

(png, pdf)

../../_images/fill_between_demo_02.png

(png, pdf)