

(Source code, png, pdf)

'''
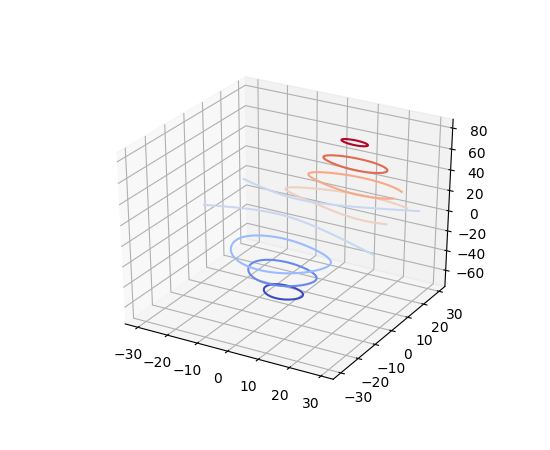
Demonstrates plotting contour (level) curves in 3D.
This is like a contour plot in 2D except that the f(x,y)=c curve is plotted
on the plane z=c.
'''
from mpl_toolkits.mplot3d import axes3d
import matplotlib.pyplot as plt
from matplotlib import cm
fig = plt.figure()
ax = fig.gca(projection='3d')
X, Y, Z = axes3d.get_test_data(0.05)
# Plot contour curves
cset = ax.contour(X, Y, Z, cmap=cm.coolwarm)
ax.clabel(cset, fontsize=9, inline=1)
plt.show()
Keywords: python, matplotlib, pylab, example, codex (see Search examples)