

(Source code, png, pdf)
'''
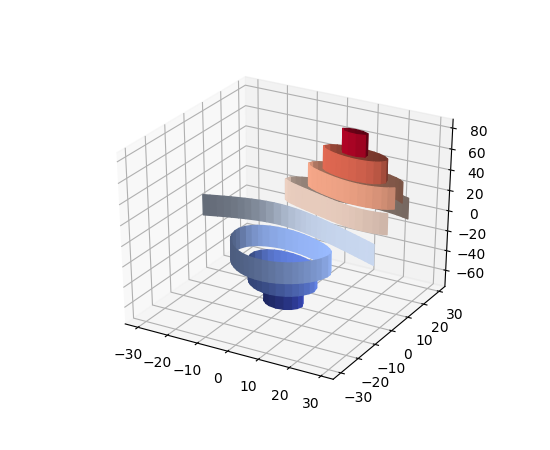
Demonstrates plotting contour (level) curves in 3D using the extend3d option.
This modification of the contour3d_demo example uses extend3d=True to
extend the curves vertically into 'ribbons'.
'''
from mpl_toolkits.mplot3d import axes3d
import matplotlib.pyplot as plt
from matplotlib import cm
fig = plt.figure()
ax = fig.gca(projection='3d')
X, Y, Z = axes3d.get_test_data(0.05)
cset = ax.contour(X, Y, Z, extend3d=True, cmap=cm.coolwarm)
ax.clabel(cset, fontsize=9, inline=1)
plt.show()
Keywords: python, matplotlib, pylab, example, codex (see Search examples)