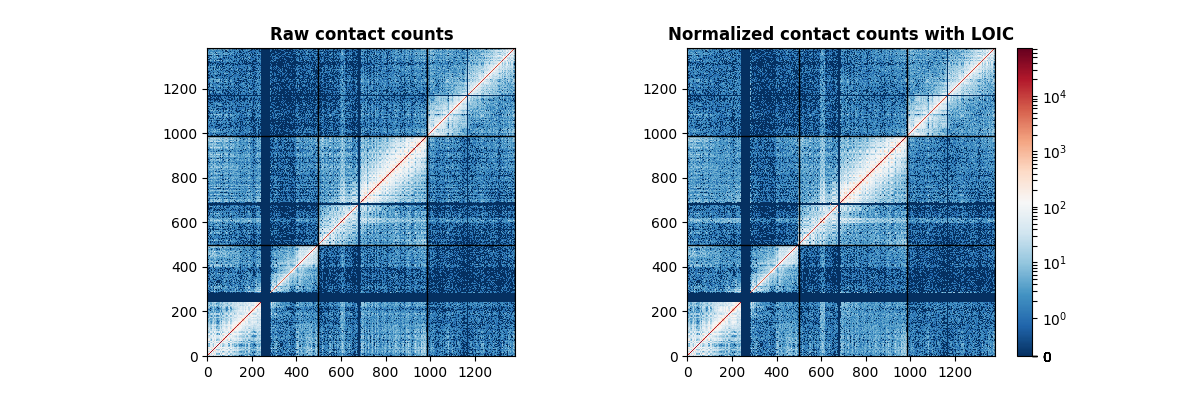
Normalizing a cancer contact count matrix with LOIC
from iced import datasets
from iced import normalization
import matplotlib.pyplot as plt
from matplotlib import colors

# Loading a sample dataset
counts, lengths, cnv = datasets.load_sample_cancer()

normed = normalization.ICE_normalization(counts, counts_profile=cnv)

# Plotting the results using matplotlib
chromosomes = ["I", "II", "III", "IV", "V", "VI"]

fig, axes = plt.subplots(ncols=2, figsize=(12, 4))

axes[0].imshow(counts, cmap="RdBu_r", norm=colors.SymLogNorm(1),
               origin="bottom",
               extent=(0, len(counts), 0, len(counts)))

[axes[0].axhline(i, linewidth=1, color="#000000") for i in lengths.cumsum()]
[axes[0].axvline(i, linewidth=1, color="#000000") for i in lengths.cumsum()]
axes[0].set_title("Raw contact counts", fontweight="bold")

m = axes[1].imshow(normed, cmap="RdBu_r", norm=colors.SymLogNorm(1),
                   origin="bottom",
                   extent=(0, len(counts), 0, len(counts)))
[axes[1].axhline(i, linewidth=1, color="#000000") for i in lengths.cumsum()]
[axes[1].axvline(i, linewidth=1, color="#000000") for i in lengths.cumsum()]
cb = fig.colorbar(m)
axes[1].set_title("Normalized contact counts with LOIC", fontweight="bold")
Total running time of the script: ( 0 minutes 2.581 seconds)