Extracting parts of a contact map
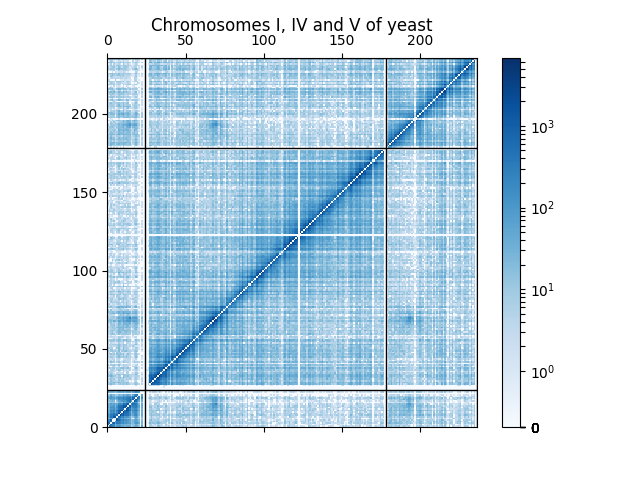
This example shows how to extract contact counts associated to some chromosomes of the contact maps. Here, we extract chromosomes 1, 4 and 5 of the budding yeasts contact map

import matplotlib.pyplot as plt
from matplotlib import colors

from iced import datasets
from iced.utils import extract_sub_contact_map


# Loading a sample dataset
counts, lengths = datasets.load_sample_yeast()
sub_counts, sub_lengths = extract_sub_contact_map(counts, lengths, [0, 3, 4])

fig, ax = plt.subplots()
m = ax.matshow(sub_counts, cmap="Blues", norm=colors.SymLogNorm(1),
               origin="bottom",
               extent=(0, len(sub_counts), 0, len(sub_counts)))
[ax.axhline(i, linewidth=1, color="#000000") for i in sub_lengths.cumsum()]
[ax.axvline(i, linewidth=1, color="#000000") for i in sub_lengths.cumsum()]
cb = fig.colorbar(m)
ax.set_title("Chromosomes I, IV and V of yeast")
Total running time of the script: ( 0 minutes 0.221 seconds)